|
Profinet EIP EtherCAT
EGD UDP RFM RtEthernet Tc-net S7 Modbus OPC iso Ads Siemens
AB,GE,Mitsubishi,Beckhoff,MOOG,Schneider,ABB,Alstom,Driver,Domestic
PLC,Special Board QDR quality data
recording (digital steel coil) centimeter and millisecond level, supports
32+clients online Equipment testing, fault
diagnosis, quality analysis, ikoPDA CHPDA PLC-PDA, Full-stack Self-developed |
3rd PDA formats &
Rich proprietary features Global Standards,
Exceptional Value Simplified for Full Customization &
OEM with Open APIs Proven by Hundreds of |
||||
|
Process Data
Acquisition �C CHPDA -- Detailed analysis of
quality manage & industrial big data sources -- Full stack develop & Fully intellectual property
owned |
|||||
|
|
|||||
|
6 DCC - Digital Coil Conversion and full process quality management |
|||||
|
20
Comprehensive data acquisition system for steelmaking plants |
|||||
|
21 A
large amount of S7 communication causes network instability |
|||||
|
11 HDP - High frequency density and speed Data Platform
construction |
|||||
|
12 HDC - Hot rolled high-frequency high-density
Digital steel Coil |
|||||
|
26
Research Form for PDA System Configuration in the Steel Industry |
|||||
3 LTA - Long historical Trend Analysis
system
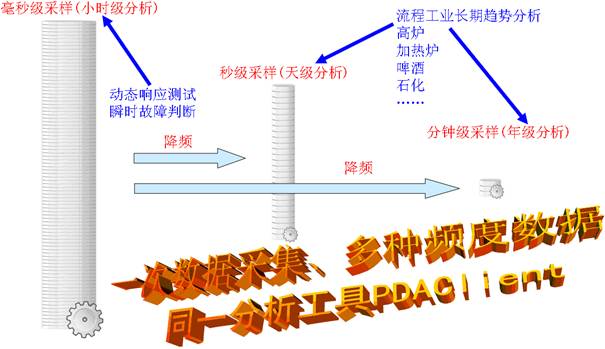
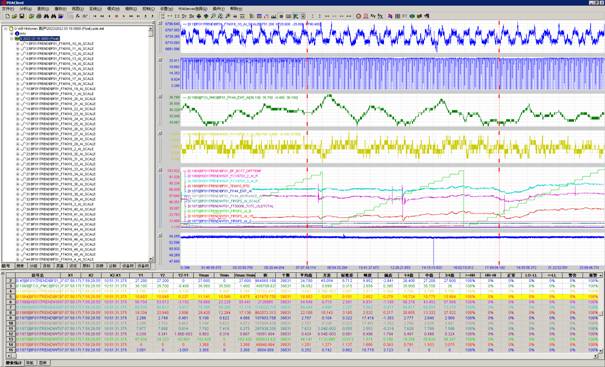
In addition to millisecond level data records, slowly changing production processes require monthly, quarterly, and annual curve analysis. The PDA system can collect multiple frequency reduction data at once, allowing for rapid analysis of long-term trends (Long Trend Analysis). It can be widely used in process industries such as blast furnaces, heating furnaces, petrochemicals, beer, and the analysis of parameters such as liquid level and temperature. The main significance of long-term trend analysis is twofold: firstly, to understand the trend and regularity of phenomena over time; The second is to predict the future development prospects and trends of phenomena. The reason why temporal data has long-term trends is because it is influenced by certain basic and decisive factors. The stronger the influence of these dominant factors, the more obvious the long-term trend. Therefore, by analyzing the long-term trends of time series data, the internal mechanisms of phenomenon development and changes can be grasped, and the effectiveness of policies and measures taken in the past can be evaluated; The third is to remove long-term trend components from the time series, in order to facilitate the decomposition of other types of influencing factors, such as seasonal changes, cyclical changes, and irregular changes. The main methods for measuring long-term trend values include: extended time interval method, moving average method, and least squares method. The extended time interval method refers to the method of eliminating fluctuations in the values of various indicators caused by accidental factors due to the short time interval by expanding the time of each indicator in the dynamic sequence, so that the smoothed dynamic sequence can significantly reflect the overall trend of phenomenon development and changes. The moving average method refers to the method of moving a dynamic sequence period by period to expand the time interval, while calculating the time series average for each indicator value of a new dynamic sequence that has already expanded the time interval, thereby forming a derived dynamic sequence from the moving average. The series of moving time series averages obtained through moving average are the trend values of their corresponding periods. The least squares method, also known as the least squares method, is a commonly used method for estimating regression model parameters. The basic principle is to require the sum of squares of the deviations between the actual value and the trend value to be the smallest, in order to fit an excellent trend model and determine long-term trends.
Figure 3.1 PDA Long term historical Trend Data Frequency Reduction A high-speed acquisition can obtain data of multiple frequencies, and changing the backup point to a formal point or adding or reducing points at the end of the connection does not affect the normal conversion work. LTAServer.exe is located in the PDA system file directory, and is converted based on the data files generated by PDA and saved in the directory specified by BigDataDir in Config.csv. The generated data files are saved in the directory specified by BigDataDir. LTAServer scan and convert at startup and every 12 hours interval thereafter. 3.1 Millisecond
level - hourly data analysis
Collect data every 10 milliseconds and generate a data file every 10 minutes. 3.2 Second
level - monthly data analysis
Collect data once a second and generate a data file once a day. 3.3 10
second level - quarterly annual data analysis
Collect data every 10 seconds, generate one data file every week, and 52 data files every year. 3.4 60
second level - annual data analysis
Collect data every 60 seconds, generate one data file every month, and 12 data files in a year. 3.5
Storage location setting and automatic deletion of historical data
In order to facilitate automatic deletion of outdated data, the data files generated by LTA should be saved in separate disk partitions, such as setting LTADir=F: in Config.csv. The system will automatically generate the following directory during operation. F: \ 1s F: \ 10s F: \ 60s When the remaining space on
the hard drive is less than 3.6 7-days
data curve at the second level for a certain project
Figure 3.2 7-days data curve with reduced frequency to second level 3.7 Longevity of blast furnace
The overhaul cycle of blast furnaces can be as long as 20 years, but the actual situation generally differs greatly from this. Some large blast furnaces burn through and need to be overhauled after more than three years of operation, causing huge economic losses, while some medium-sized blast furnaces burn through and need to be overhauled after more than six months of operation. These blast furnaces are equipped with various leading domestic expert prediction models, and practice has shown that relying solely on intelligent models is far from enough. Therefore, it is necessary to intuitively, concisely, and efficiently analyze the long-term trend curves of the temperature and pressure fields of the throat, body, waist, belly, and hearth for one, two, and three years, in order to timely identify hidden dangers. LTA can operate independently and play a unique and important role in the field of blast furnace longevity. It can also serve as a necessary supplement to various intelligent models. 3.8 Increase the age of the converter
Increasing the service life of steelmaking converters, such as from 3000 to 4000 furnaces, has significant benefits and significance. In recent years, converters have gradually been equipped with PDA systems, and the combination of LTA and process can provide intuitive guidance for production and maintenance. The LF and RH furnaces are gradually installing PDAs for fault analysis, and LTA can also be used to increase furnace life. 3.9 Converting
long-term historical trend files of a blast furnace AB to PDA format
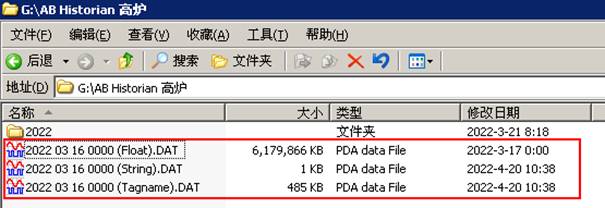
AB company has a .dat file that records long-term historical trends, but its opening speed is slow. HistorianToPDA.exe can convert this dat file into a PDA format. dat file, which can be used to quickly open trend charts for several months using PDAClient. The following figure shows the original data file for a day, with a sampling cycle of 1 second.
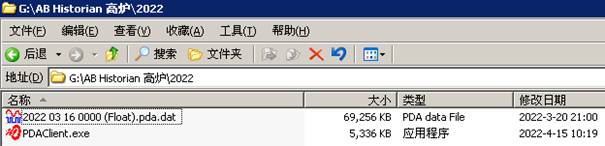
Figure 3.3 Long term raw data of AB company The following figure shows a data file converted to PDA format with a compression rate close to 100 times.
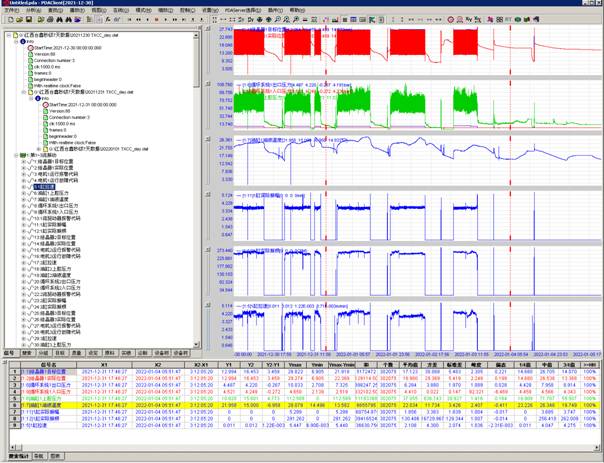
Figure 3.4 Conversion of AB Company's Long Term Raw Data to PDA Format The following figure shows the trend curve.
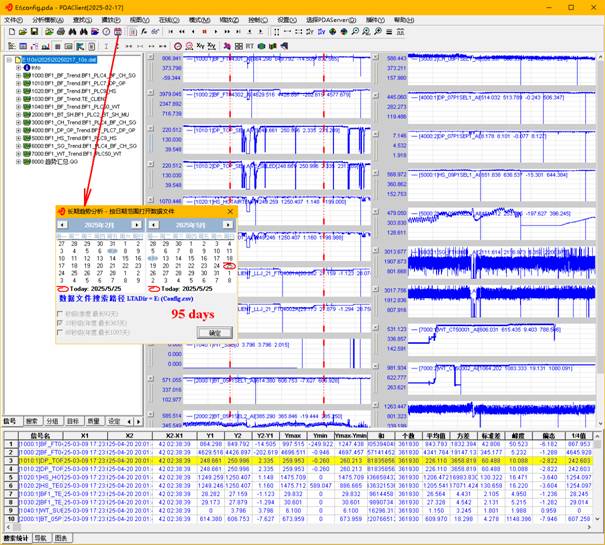
Figure 3.5 Analysis of AB Company's Long Term Raw Data Conversion Using PDA Historian1s.exe merges the converted PDA format dat files of the same date and 1-second level, and saves them to the \1s directory. Historian10s.exe will reduce the frequency of dat files in the \1s directory to 10s level, and store one dat file per week in the \10s directory. Historian60s.exe will reduce the frequency of dat files in the \1s directory to 60s level, and store one dat file per month in the \60s directory. PDAClient automatically selects the corresponding directory based on the time range to search and open the file query curve. Open 1-second level data within 92 days, automatically open 10 second level data within 365 days, and automatically open 60 second level data within 1095 days.
Figure 3.6 Long term Trend Analysis by Date Range Selection |
|||||
|
|
|||||
|
Apparatus test&Fault diagnosis&Quality analysis |
Millisecond data sampling Real-time data compression Capture signal instantaneous mutation |
||||
|
�������� �ٶ� ��Ѷ ���� ���� �Ѻ� ��� �Ա� ���� �й��Զ����� �й������� ������ ��Τ�� �������� �������վ �Ƿ�����վ �������վ Я�� ֪�� �й���� ��ұ���� ��ұ���� ��ұ�Ϸ� ��ұ���� ��ұ���� ��ұ���� ��ұ���� ��ұ���� �й����� ���� ���� ��� ���� �Ӹ� �� ��ICP��2025092850�� ��Ȩ����©Copyright:2025-2035. ��γ���¿Ƽ����人������˾ |
|||||
Develop communication protocol, Customized
analysis function, Open data interface, XinChuang domestic obsession
PDAServer
PDAClient