|
Profinet EIP EtherCAT
EGD UDP RFM RtEthernet Tc-net S7 Modbus OPC iso Ads Siemens
AB,GE,Mitsubishi,Beckhoff,MOOG,Schneider,ABB,Alstom,Driver,Domestic
PLC,Special Board QDR quality data
recording (digital steel coil) centimeter and millisecond level, supports
32+clients online Equipment testing, fault
diagnosis, quality analysis, ikoPDA CHPDA PLC-PDA, Full-stack Self-developed |
3rd PDA formats &
Rich proprietary features Global Standards,
Exceptional Value Simplified for Full Customization &
OEM with Open APIs Proven by Hundreds of |
|||
|
Process Data
Acquisition �C ikoPDA -- Detailed analysis of
quality manage & industrial big data sources -- Full stack develop & Fully intellectual property
owned |
||||
|
|
||||
|
6 DCC - Digital Coil Conversion and full process quality management |
||||
|
20 Comprehensive data
acquisition system for steelmaking plants |
||||
|
21 A
large amount of S7 communication causes network instability |
||||
|
11 HDP - High frequency density and speed Data Platform
construction |
||||
|
12 HDC - Hot rolled high-frequency high-density
Digital steel Coil |
||||
|
26
Research Form for PDA System Configuration in the Steel Industry |
||||
20 Comprehensive data acquisition
system for steelmaking plants
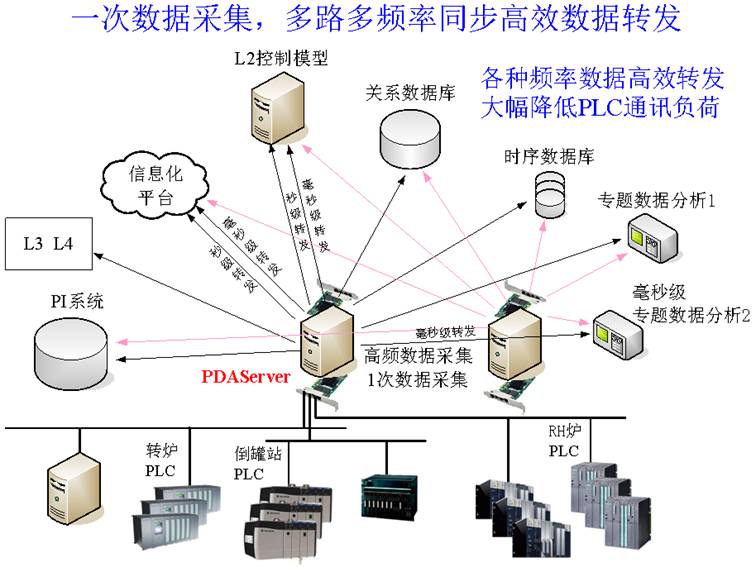
Comprehensive data acquisition system for 20 steelmaking plants The equipment in the steel plant mainly includes: pouring station, desulfurization, converter, LF furnace, RH furnace. Each set of equipment includes approximately one PLC controller and uses one or more PDA systems. The PDA system performs millisecond level data acquisition for L1 fault diagnosis and provides high-speed, medium speed, and low-speed data services to meet the data needs of L2, L3, information platforms, specialized systems, etc. It achieves efficient data forwarding through multi-channel and multi frequency synchronization in one data acquisition, greatly reducing the communication load of PLC. The following figure adopts a PDA high-speed data acquisition and analysis system, with 30000 collection points and a collection frequency of 10 milliseconds. It supports simultaneous collection and high-speed forwarding of data from dozens of PLCs and L2 servers. Real time data curve analysis supports multiple units online simultaneously, with a minimum of 30 units online. The signals that need to be collected are packaged and sent to the PDA server at high speed in the PLC. The PDA server then packages and sends them based on the configured data and target IP. This forwarding cycle can reach milliseconds. PDAServer supports protocols such as Modbus TCP Server, OPC UA, MQTT to achieve second level data access. The forwarded data and forwarding frequency are configured through configuration. L2�� Information platforms and other platforms may require data of multiple frequencies, which can be achieved by configuring multiple links.
|
|
|
|
|
|
Apparatus test&Fault diagnosis&Quality analysis |
Millisecond data sampling Real-time data compression Capture signal instantaneous mutation |
|
�������� �ٶ� ��Ѷ ���� ���� �Ѻ� ��� �Ա� ���� �й��Զ����� �й������� ������ ��Τ�� �������� �������վ �Ƿ�����վ �������վ Я�� ֪�� �й���� ��ұ���� ��ұ���� ��ұ�Ϸ� ��ұ���� ��ұ���� ��ұ���� ��ұ���� ��ұ���� �й����� ���� ���� ��� ���� �Ӹ� �� ��ICP��2025092850�� ��Ȩ����©Copyright:2025-2035. ��γ���¿Ƽ����人������˾ |
|
Develop communication protocol, Customized
analysis function, Open data interface, XinChuang domestic obsession
PDAServer
PDAClient